

 ภาษาอังกฤษ
 เวอร์บี
 เอสปันญ่อล
×
รหัสผ่าน
ได้รับรหัสผ่าน
ป้อนรหัสผ่านเพื่อดาวน์โหลดเนื้อหาที่เกี่ยวข้อง
ส่ง
 +86-15267462807
 ภาษา
ภาษา
In the world of wastewater treatment, the Blower Room is often the largest consumer of energy, accounting for up to 60% of a plant’s total electricity usage . While operators spend a great deal of time monitoring Dissolved Oxygen (DO) levels to keep bacteria happy, there is a “silent” metric that determines whether that oxygen is being delivered affordably or at a massive loss: Dynamic Wet Pressure (DWP).
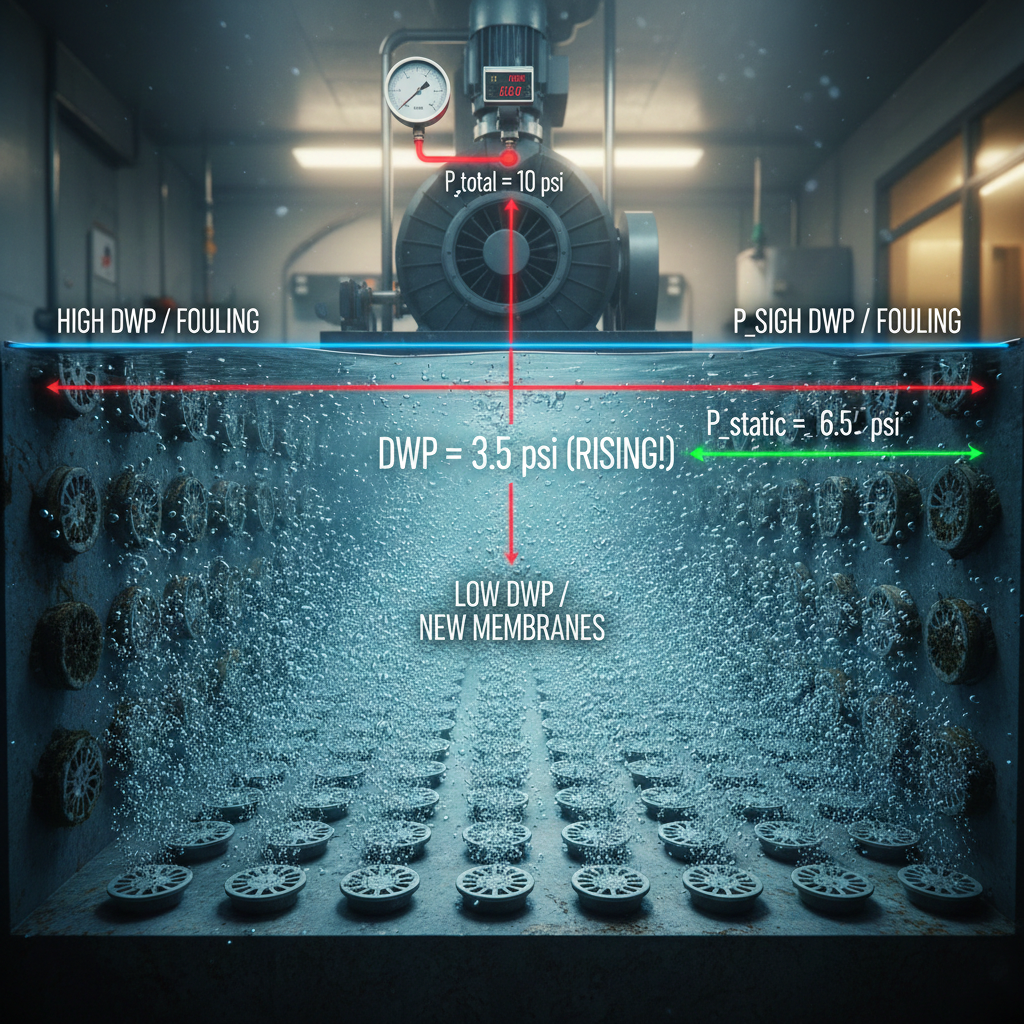
To understand DWP, we must first distinguish it from the total pressure measured at the blower. When air travels from the blower to the bottom of an aeration tank, it faces two primary obstacles:
Mathematically, the relationship is expressed as:
(Where P friction_loss is the resistance within the piping itself).
(Where is the resistance within the piping itself).
Think of the aeration system like the human circulatory system. The Blower is the heart, the Pipes are the arteries, and the Diffusers are the capillaries.
If your “capillaries” (the diffuser slits) become narrow or stiff, your “heart” (the blower) must pump significantly harder to move the same amount of oxygenated “blood” (air) through the system. This is essentially “high blood pressure” for your plant. You might still achieve your target DO levels, but your equipment is under immense stress, and your energy bills are skyrocketing.
DWP is rarely a fixed number. Because membranes are made of elastomers (like EPDM or Silicone), they change over time. As they lose flexibility or become clogged with minerals and “bio-slime,” the DWP creeps upward.
The DWP of a diffuser is not a static number; it is a dynamic response to air pressure and fluid mechanics. Understanding the “physics of the slit” explains why some diffusers save money while others drain budgets.
A diffuser membrane is essentially a high-tech check valve. When the blower is off, water pressure and the natural tension of the elastomer (rubber) keep the slits tightly closed. This prevents sludge from entering the piping.
To start aeration, the blower must create enough internal pressure to overcome two forces:
The way a membrane is perforated is a delicate balance of engineering.
As air flow increases, the DWP also increases. This is known as the Orifice Effect . At low airflows, the slits are barely open. As you “turn up” the blowers, the slits must expand further.
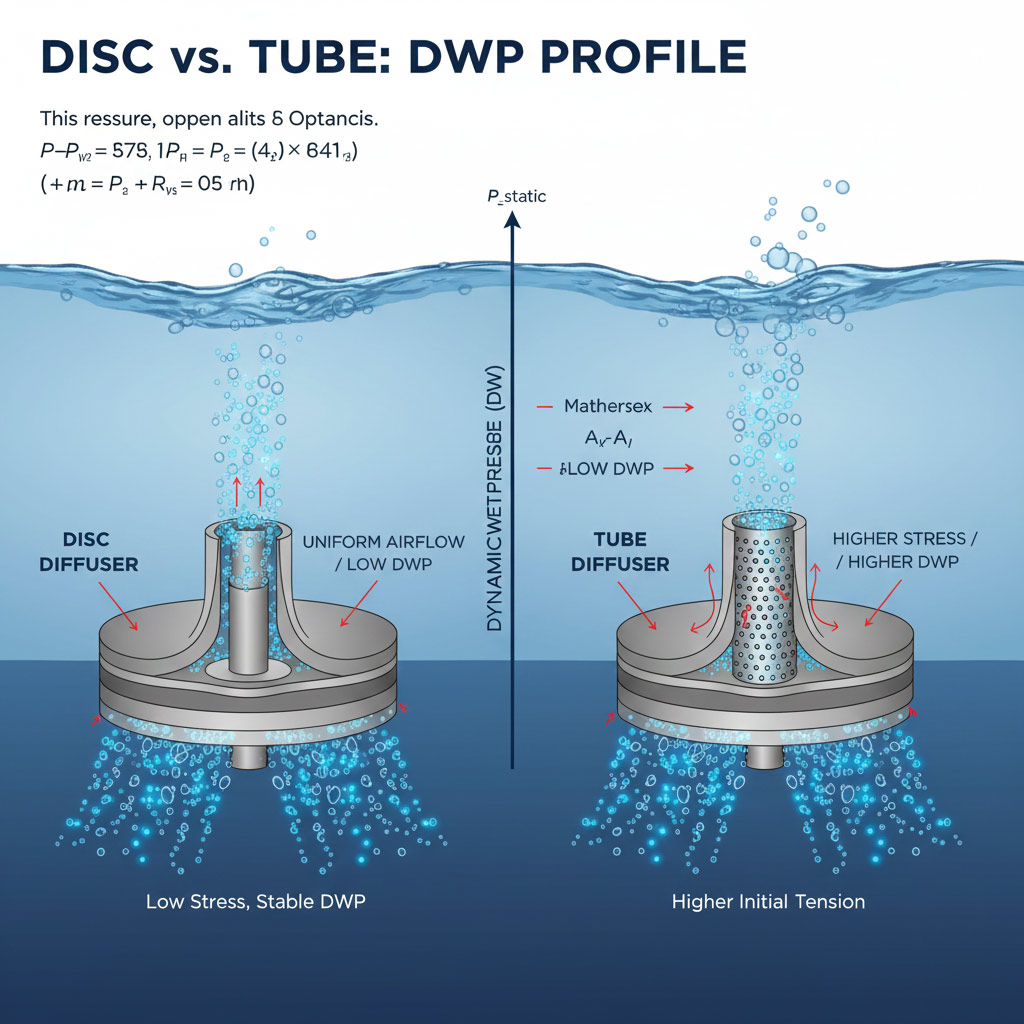
While both use similar membrane materials, their shape significantly impacts their pressure profile.
| Feature | Disc Diffuser DWP | Tube Diffuser DWP |
|---|---|---|
| Air Distribution | Centered. Air pushes upward against the flat or slightly arched surface. | Air must expand the membrane around a rigid cylindrical support. |
| Uniformity | Highly uniform. Pressure is distributed evenly across the disc face. | Can be uneven. If not perfectly level, air tends to escape at the “high end,” leading to uneven wear. |
| Typical Range | 10" to 22" | 15" to 30" |
| Long-Term DWP | Generally more stable due to lower mechanical “stretch” required per bubble. | Can increase faster if the membrane “shrinks” or tightens around the internal support pipe. |
The Disc Diffuser is generally considered the “gold standard” for DWP stability. Because the membrane is held only at the perimeter, it can flex freely like a drumhead. The Tube Diffuser , however, is stretched over a pipe; this creates more initial tension (pre-load), which often results in a slightly higher starting DWP compared to a disc of the same material.
In a perfect world, DWP would remain constant. However, in the harsh environment of a wastewater tank, DWP inevitably begins to rise. Engineers refer to this gradual increase as “Pressure Creep.” Understanding the three primary causes of this creep is essential for predicting when your diffusers will reach their breaking point.
Wastewater is a nutrient-rich soup designed to grow bacteria. Unfortunately, these bacteria don’t just stay in suspension; they love to attach to surfaces.
This is a chemical process rather than a biological one. It is most common in regions with “hard water” or in plants that use chemicals like Ferric Chloride for phosphorus removal.
Even in clean water, DWP will eventually rise due to the chemistry of the membrane itself.
You cannot manage what you do not measure. For many years, DWP was ignored until blowers began to fail. Today, smart plants use a proactive monitoring approach.
Since you cannot easily put a pressure sensor inside a submerged diffuser, we use the “Top-Side” calculation :
The most accurate way to “diagnose” your diffusers is a Step Test.
Once DWP begins to climb, operators have several tools at their disposal to “reset” the pressure before it causes equipment damage or budget overruns. These methods range from simple operational shifts to chemical interventions.
This is the first line of defense against biological fouling.
If mineral scaling (calcium or iron) is the culprit, “bumping” won’t be enough. You need to dissolve the crust.
If a tank is drained for other maintenance, manual cleaning is the gold standard.
To justify the cost of cleaning or replacing diffusers, engineers must translate DWP (inches of water) into Money (Kilowatts) .
The power required by a blower is directly proportional to the total discharge pressure. A simplified formula for the change in power (P) relative to a change in pressure ( ∆p ) is:

le Scenario:
If the plant spends $200,000 per year on aeration electricity, that 1 psi “creep” is costing them $20,000 a year in wasted power.

By: Michael Knudson Stenstrom - ResearchGate
https://www.researchgate.net/figure/Standard-Aeration-Efficiency-In-Clean-SAE-and-Process-aFSAE-Water-for-FinePore-and_fig3_304071740
The most efficient wastewater plants in the world do not wait for a blower to trip or a membrane to tear. They monitor DWP as a “Live Health Metric.” By tracking the trend line of DWP, operators can schedule cleanings exactly when the energy savings will pay for the labor, ensuring the plant runs at the lowest possible carbon footprint.


86 - 571 - 88647609

+86-15267462807
